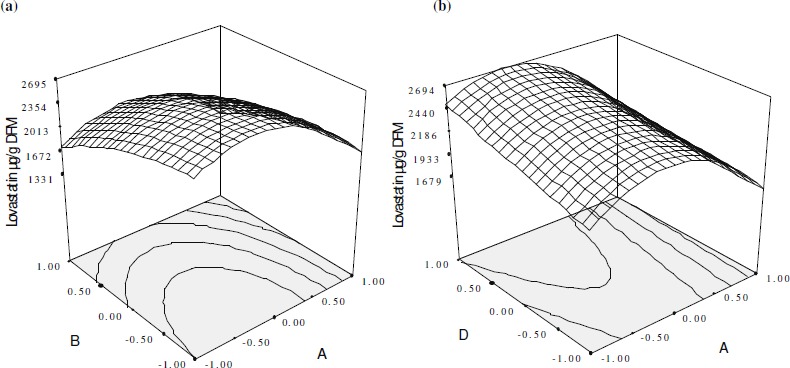
Figure 4.

(a and b) Response surface plot showing relative effect of two nutrient parameters on lovastatin production while keeping others at constant level. A, B and D represent % moisture content, particle size and trace ion concentration, respectively.
