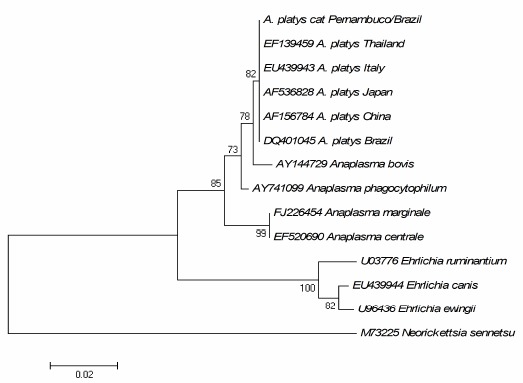
Figure 2.

Phylogenetic tree based on Anaplasma and Ehrlichia 16S rRNA; Sequences were compared with the neighbor-joining method using the MEGA 4.0 program, with N. sennetsu as outgroup. Scale bar represents the number of mutations per sequence position. The numbers at the nodes indicate the percentage of 1000 bootstrap resamplings.
