Figure 1.

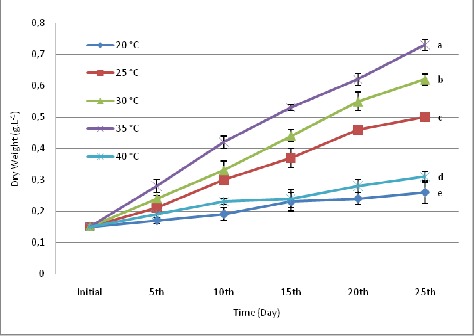
Effect of various temperatures on biomass concentration of S.platensis. Values are means ± SD (n = 3). Variable means with the same letter are not significantly different (p > 0.05).

Effect of various temperatures on biomass concentration of S.platensis. Values are means ± SD (n = 3). Variable means with the same letter are not significantly different (p > 0.05).