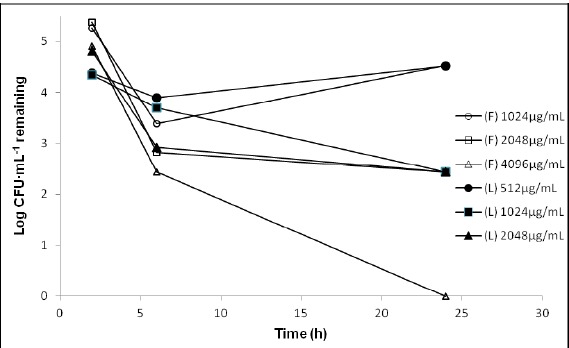
Figure 3.

Time-kill curves for P. aeruginosa SPM-1 exposed to 1, 2 and 4 times the minimum inhibitory concentration (MIC) of free ceftazidime (F) and liposomal ceftazidime (L).

Time-kill curves for P. aeruginosa SPM-1 exposed to 1, 2 and 4 times the minimum inhibitory concentration (MIC) of free ceftazidime (F) and liposomal ceftazidime (L).