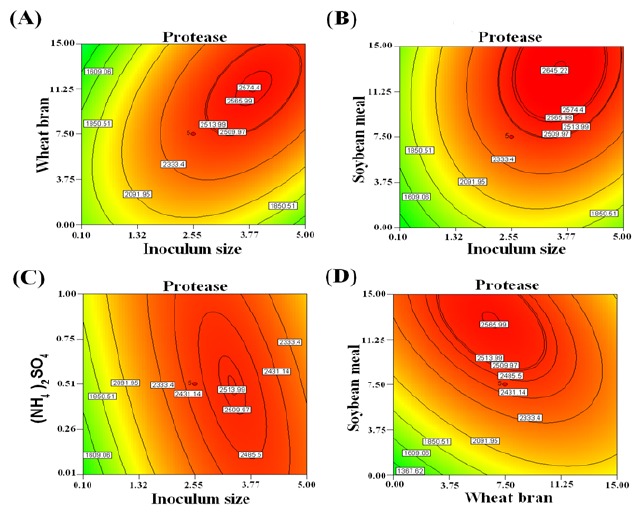
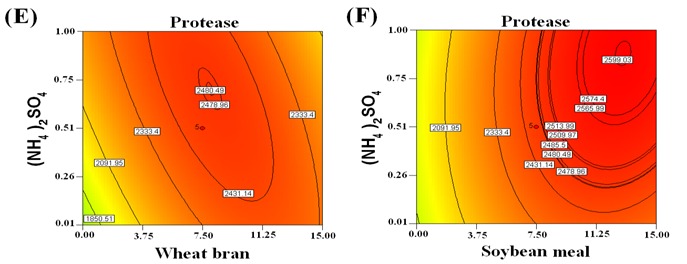
Figure 1.


Contour plots for Protease production showing the interactive effects of wheat bran and inoculum size (A), soybean meal and inoculum size (B), (NH4)2SO4 and inoculum size (C), soybean meal and wheat bran (D), (NH4)2SO4 and wheat bran (E), soybean meal and (NH4)2SO4 (F). Other variables were kept at central level.
