Figure 2.

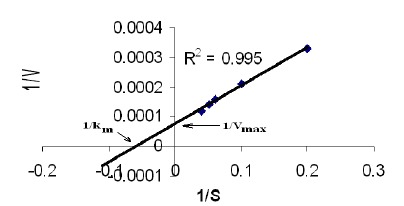
Lineweaver-Burk plot for neutral protease under varying substrate (casein) concentrations (5–35 mg/mL) indicating the Km and Vmax values

Lineweaver-Burk plot for neutral protease under varying substrate (casein) concentrations (5–35 mg/mL) indicating the Km and Vmax values