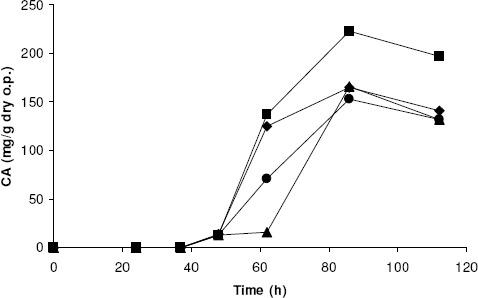
Figure 4.

Evolution of CA throughout SSF after water addition: A) control without addition of water (υ); B) addition of 0.08 mL/flask every 12 h starting from 48 h (?); C) addition of 0.12 mL/flask every 12 h starting from 48 h (?); and D) addition of 0.12 mL/flask every 12 h starting from 62 h (A). Results are the average of three independent experiments. Standard deviations were below 2.1 % of the mean value.
