Figure 4.

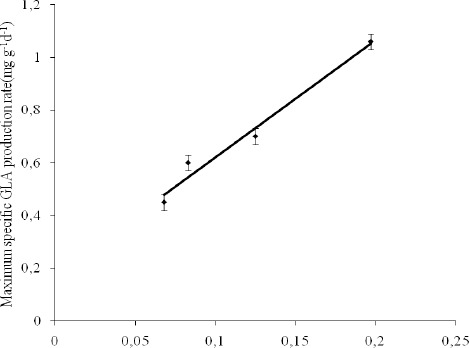
Comparison between the maximum specific GLA production rate and maximum specific growth rates of Spirulina platensis calculated on the peak day of GLA production (day 6).

Comparison between the maximum specific GLA production rate and maximum specific growth rates of Spirulina platensis calculated on the peak day of GLA production (day 6).