
Figure 2.
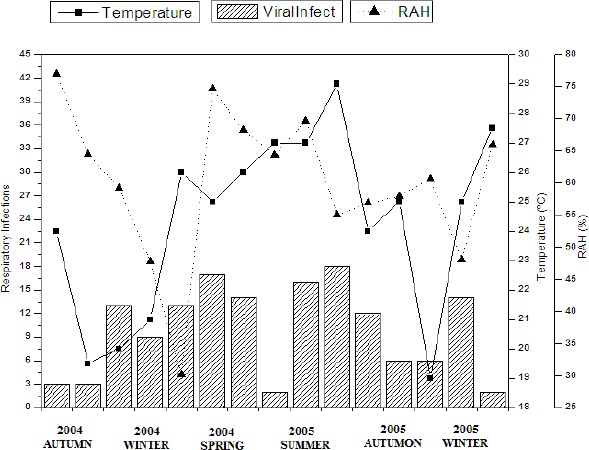
Correlation of viral respiratory infections to monthly average temperature and monthly average relative air humidity, showing the variation of infections according to the variation of the meteorological factors [T (°C) – monthly average of temperature in °C, RAH – monthly average of relative air humidity in (%)].