
Figure 3.
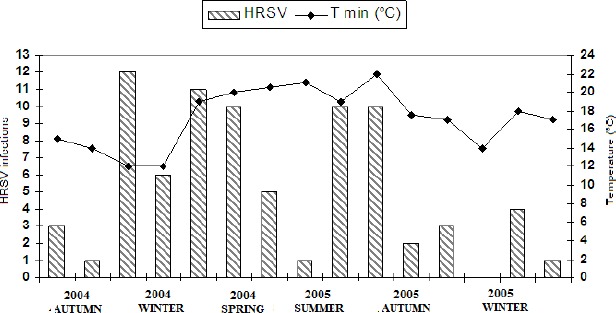
Association of HRSV infections to monthly average of minimal temperatures demonstrating the variation of infections according to the climatic season and variation of relative air humidity.
Official websites use .gov
A
.gov website belongs to an official
government organization in the United States.
Secure .gov websites use HTTPS
A lock (
) or https:// means you've safely
connected to the .gov website. Share sensitive
information only on official, secure websites.
Association of HRSV infections to monthly average of minimal temperatures demonstrating the variation of infections according to the climatic season and variation of relative air humidity.