Figure 1.

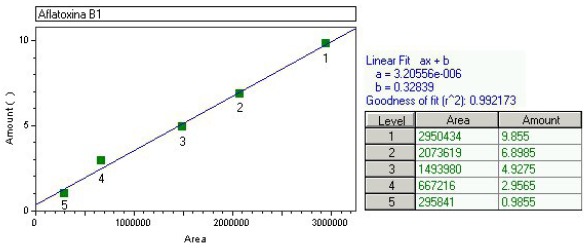
Standard curve used for the quantification of aflatoxin B1 with the area obtained in the readings, the concentration of aflatoxin B1 in ng/mL, the linear fit equation and the r2 value.

Standard curve used for the quantification of aflatoxin B1 with the area obtained in the readings, the concentration of aflatoxin B1 in ng/mL, the linear fit equation and the r2 value.