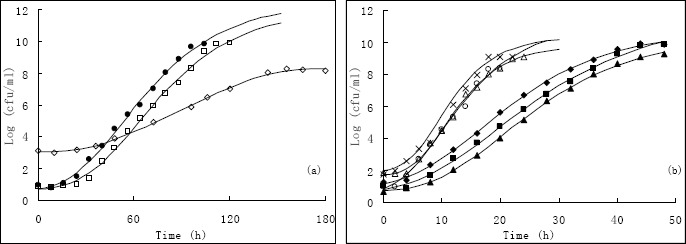
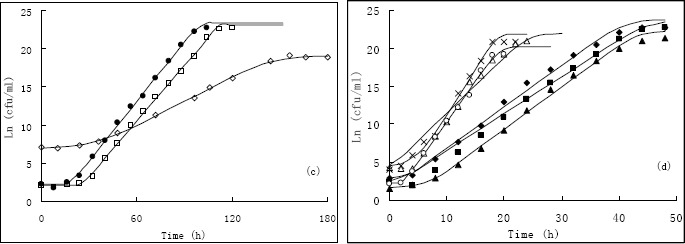
Figure 1.


The observed and Gompertz model predicted growth of Vibrio harveyi in different conditions (a), (b); the observed and Baranyi model predicted growth of Vibrio harveyi in different conditions (c), (d). (Scatter dots are observed; curves are predicted). (◇), 12.9 °C, 2%; (﹡), 15°C, 1%; (●), 15 °C, 3%; (◆), 20 °C, 0.6%; (■), 20 °C, 2%; (▲), 20 °C, 3.4%; (×), 25 °C, 1%; (△), 25 °C, 3%; (○), 27.1 °C, 2%.
