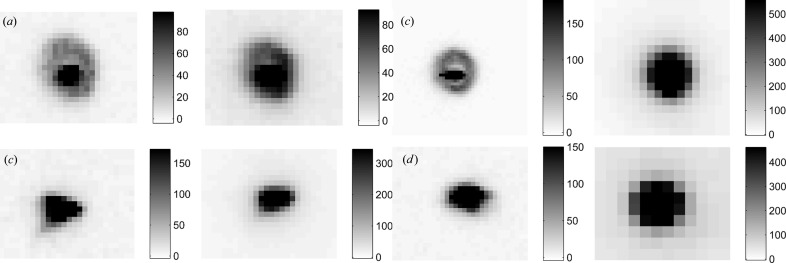
Figure 12.
Diffraction spots used for detector comparison. Each pair of images represents a different experimental configuration: (a) 20 µm beam, equal solid angle per pixel (crystal Thau4); (b) 20 µm beam, equal distance (Thau6); (c) 100 µm beam, equal solid angle per pixel (Thau13); (d) 100 µm beam, equal distance (Thau9). In each pair, the left image is from the direct-detection CCD and the right is from the Q270. In each pair, the same approximate solid angle is displayed; in (a) and (c), this results in the same number of pixels in each image, whereas in (b) and (d), fewer pixels are spanned on the Q270 than on the direct-detection CCD, which makes the pixels appear larger when printed. All images are scaled such that the grayscale maximum is 30% of the maximum value in the region of interest. The grayscale is cast in units of photons, as shown in the scale bar alongside of each image. The halo structure observed in (a) and (b) is a consequence of the glass X-ray capillary used to focus the beam. It arises from the divergence in the 20 µm beam, which is focused at the sample position and has expanded considerably at the detector position.

