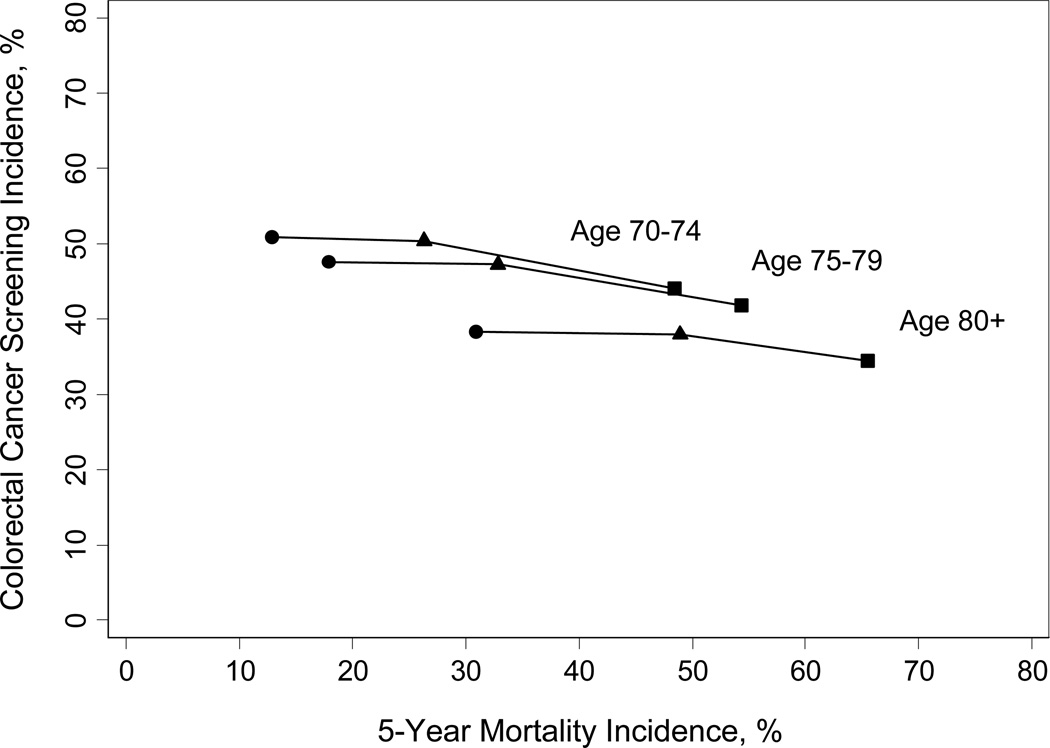
Figure 2. Colorectal cancer screening incidence versus 5-year mortality for different age groups as comorbidity increases (n=27,068).
Circles (●) indicate no comorbidity (Charlson score = 0); Triangles (▲) indicate average comorbidity (Charlson score 1–3); Squares (▪) indicate severe comorbidity (Charlson score > 4).*
*Within each age group screening incidence declined only a small amount with worsening comorbidity. The lines are included in the figure to illustrate the relatively flat incidence of screening between patients without comorbidity (●), average comorbidity (▲), and severe comorbidity (▪) for each age group. This is despite the substantial increase in 5-year mortality that occurs with worsening comorbidity. If screening was targeted to older patients with substantial life expectancies and away from those with severe comorbidity all lines would start much higher and slope down more steeply.

