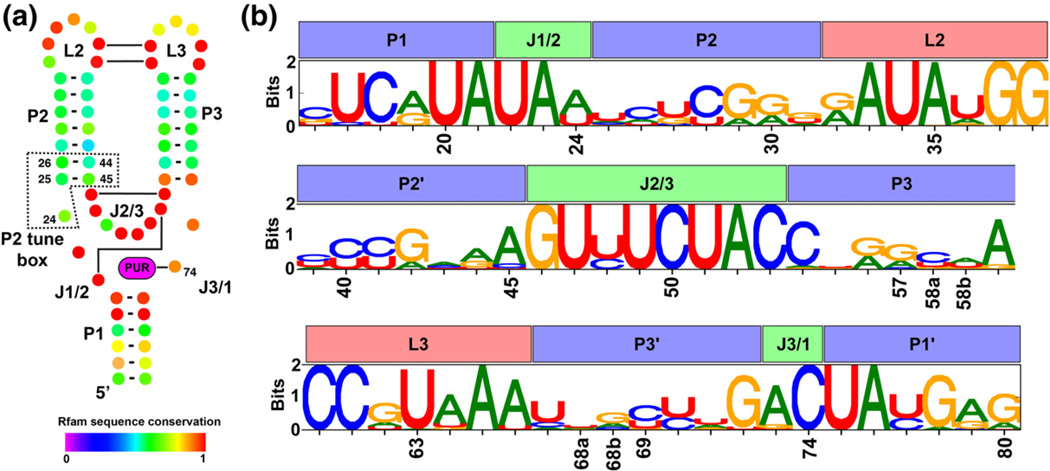
Fig. 1.
Secondary structure and positional entropy plot of the aptamer domain of purine riboswitches. (a) The conserved secondary structure of the aptamer domain is depicted such that each nucleotide position is represented as a colored dot with Watson–Crick base-pairing interactions shown as a bar/line connecting the interacting nucleotides. Nucleotide coloring corresponds to their degree of conservation, where a value of 1 denotes universal conservation (adapted from the Rfam database, accession number RF00167). (b) A sequence logo representing the nucleotide conservation as well as information content at each position in our structure-based alignment of 302 sequences. For each position, the height of each nucleotide symbol represents its frequency at that position, while the overall height represents the information content at that position.

