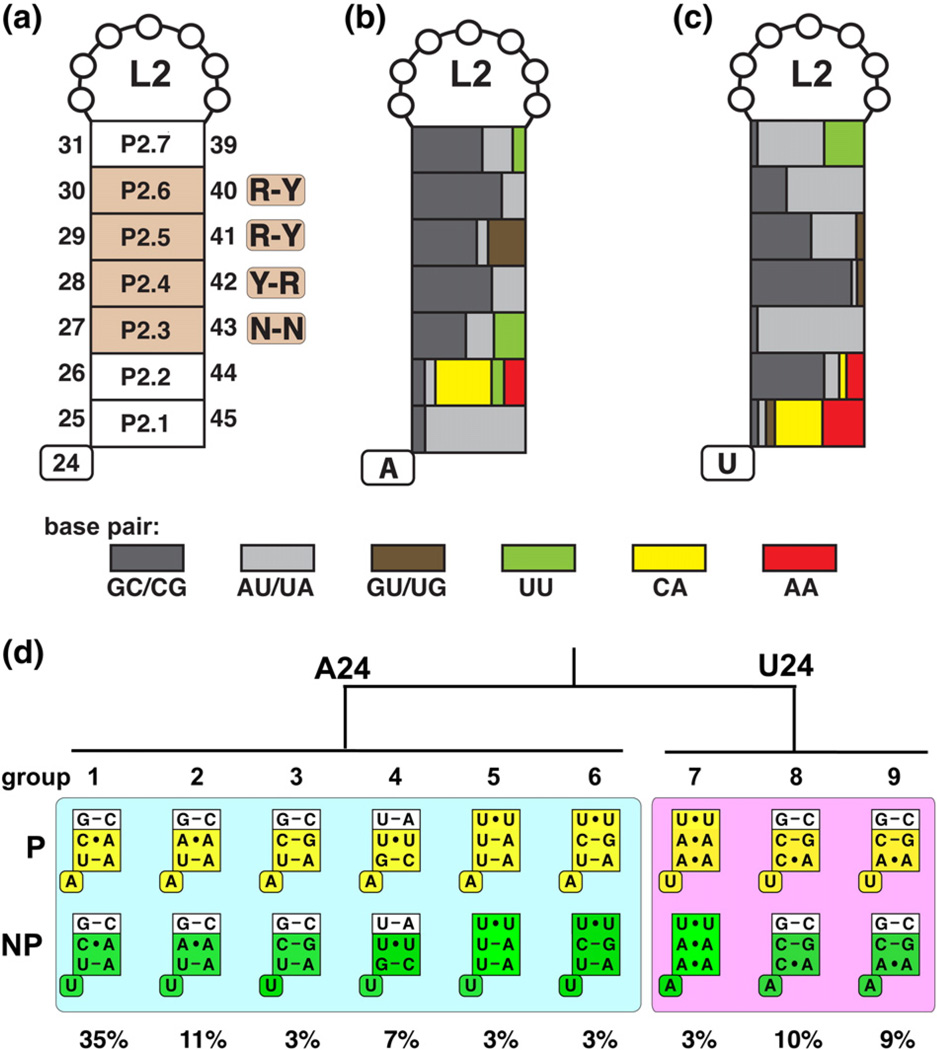
Fig. 3.
Sequence composition of the P2 stem based on a structurally backed multiple sequence alignment. A naming scheme and indication of the position as well as conservation is represented in (a) with purine (R) or pyrimidine (Y) bias indicated. (b) and (c) are color coded according to the type of base-pairing enrichment for A24 variants and U24 variants, respectively. (d) P2 sequence variants that represent a majority of all purine riboswitch aptamer domains. Aptamer variants from phylogenetically represented sequences (P) and non-phylogenetic variants (NP) with single base substitutions at position 24 are represented in yellow and green, respectively. The boxed pairs represent the P2.1, P2.2, and P2.3 pairs, consistent with Fig. 2. The abundance of each variant from the sequence alignment is indicated.

