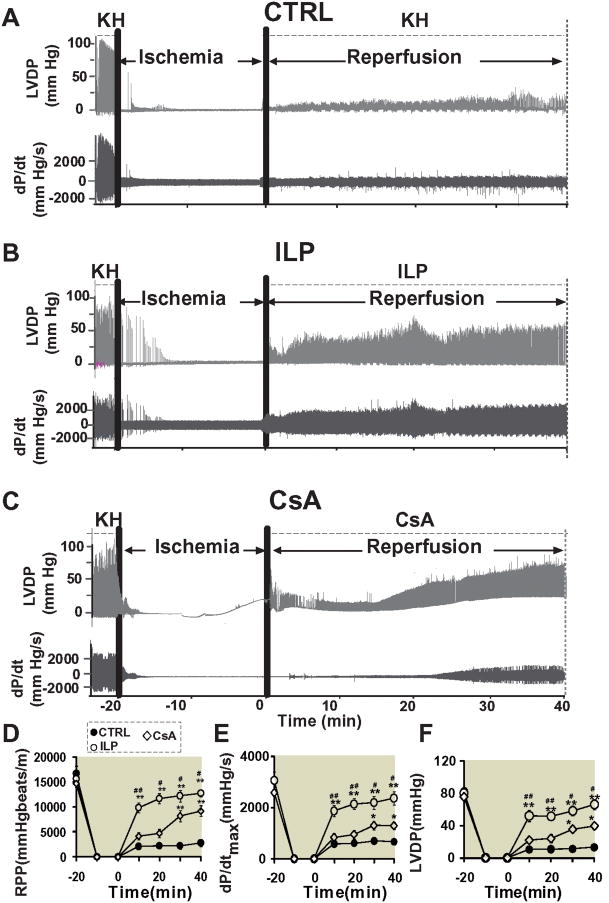
Figure 2. Dose response of intralipid and cyclosporine-A in ex vivo ischemia/reperfusionmouse model.
A. Rate pressure product (RPP) as a function of time in 0.5%, 1% and 2% intralipid (n=7). B. The area of necrosis as the percentage of total ventricular area in 0.5%, 1% and 2% intralipidgroup(ILP). C. Rate pressure product as a function of time in 0.2μM, 0.8μM and 1.5μM cyclosporine-A(CsA)( n=5). D. The area of necrosis as the percentage of total ventricular area in control group(CTRL), 0.5%, 1% and 2% intralipid group. **p=0.004, 1% ILP vs. 0.5% ILP; *p=0.022, 2%ILP vs. 0.5% ILP; &&p=0.008, 0.8μMCsA vs. 0.2μM CsA; ^^p=0.009, 1.5μM CsA vs. 0.2μM CsA.

