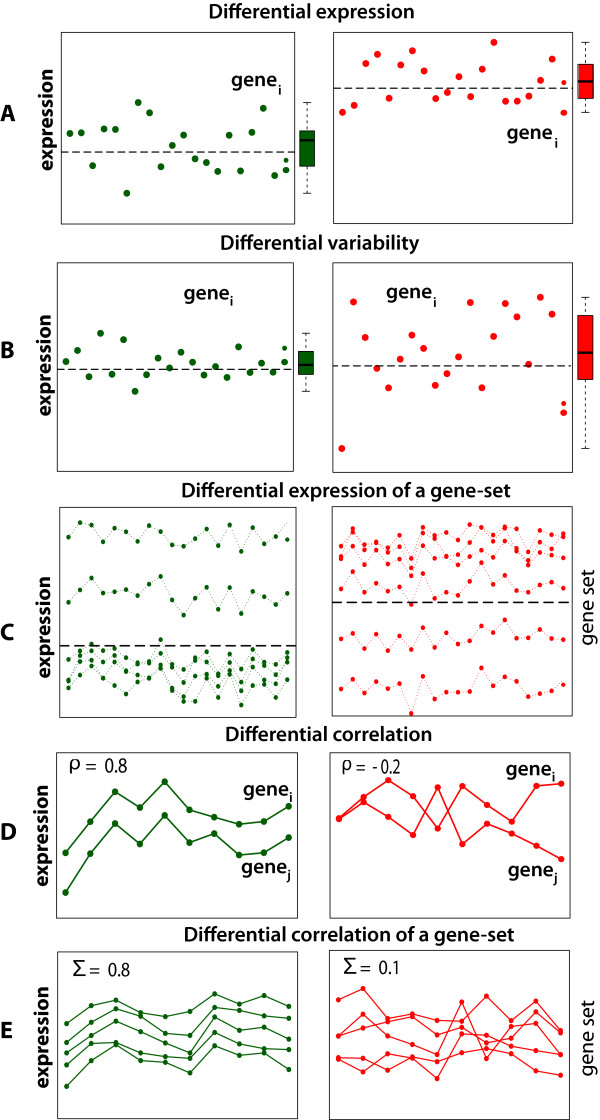
Figure 3.
Examples for different biological hypothesis that can be formulated based on different properties of gene expression data (green - control group (condition 1), red - treatment group (condition 2)). E: Σcorresponds to the covariance matrix, corresponding to a constant but different matrix for the two conditions.

