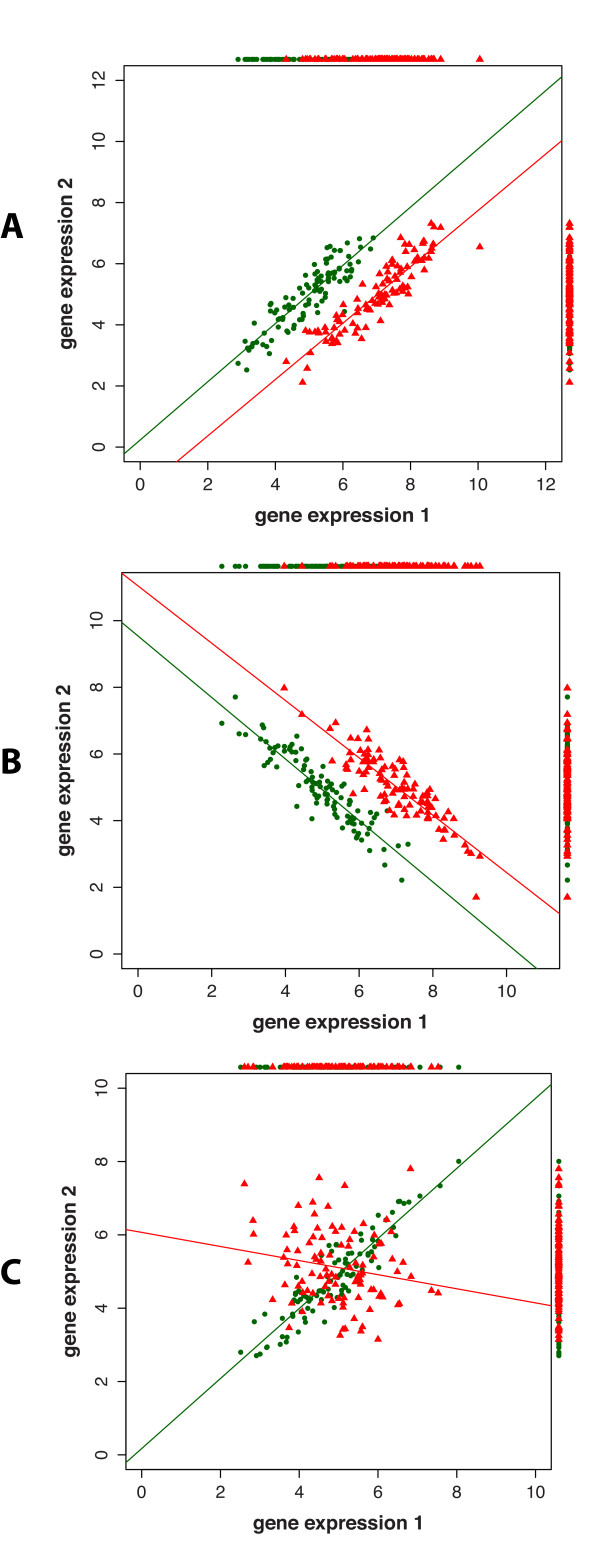
Figure 4.
The joint distribution of the expression of two genes. In A and B the expression values of the two genes show a shift in the two conditions (red and green). In C the expression values of a gene pair are anti-correlated between the two conditions. In A-C the lines correspond to linear regression fits of the colored expression values and the color dots surrounding the figures provide one-dimensional projections of the two-dimensional distributions.

