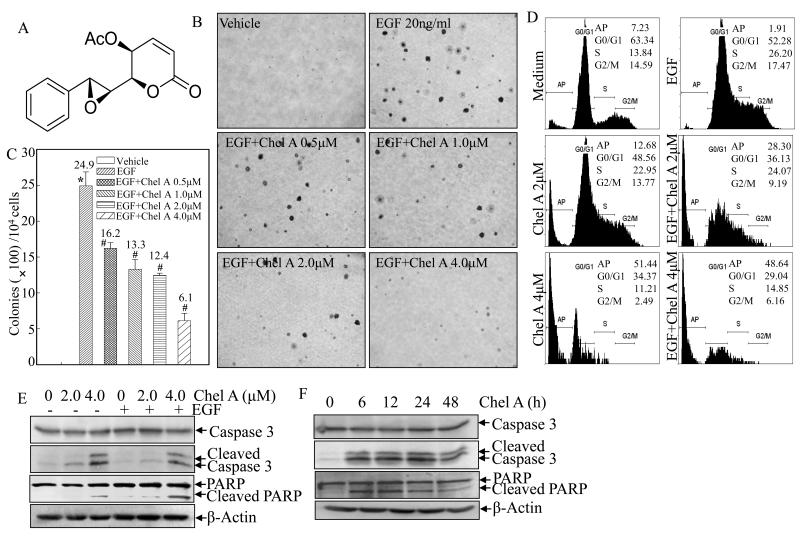
Fig. 1. The inhibition on EGF-induced cell transformation and cell apoptotic induction by Chel A in Cl41 cells.
(A) Chemical structure of Chel A. (B and C) Cl41 cells were exposed to indicate concentrations of Chel A in combination with EGF for cell transformation assay in soft agar as described in Material and Methods. After being cultured in 37 °C with 5% CO2 for 3 weeks, the colony formation was observed under inverted microscope and photographed (B). The number of colonies was scored, and presented as colonies per 104 seeded cells (C). The symbol (*) indicates a significant increase as compared with that of vehicle control (p<0.05). The symbol (#) indicates a significant decrease as compared with that of EGF treatment alone (p<0.05). Each bar indicates the mean and standard deviation of three independent experiments. (D) Cl41 cells (2×10⁵) were seeded into each well of a six-well plate and cultured with MEM containing 5% FBS at 37 °C overnight. After being cultured in MEM containing 0.1% FBS for 48 hours, the cells were treated with various concentrations of EGF and Chel A as indicated, for 48 hours, and then were fixed and stained with propidium iodide (PI) as described in Materials and Methods. Cell apoptosis was determined by flow cytometry. The result showing was representative one from three independent experiments. (E and F) Cl41 cells were seeded into each well of six-well plates and cultured the same as those for flow cytometry assay. Then cells were treated with EGF and Chel A at different concentrations (E) or for different time periods (F). The cell extracts were subjected to Western blotting as described in Materials and Methods. β-Actin was used as a control for protein loading. The result showing was a representative data from three independent experiments.

