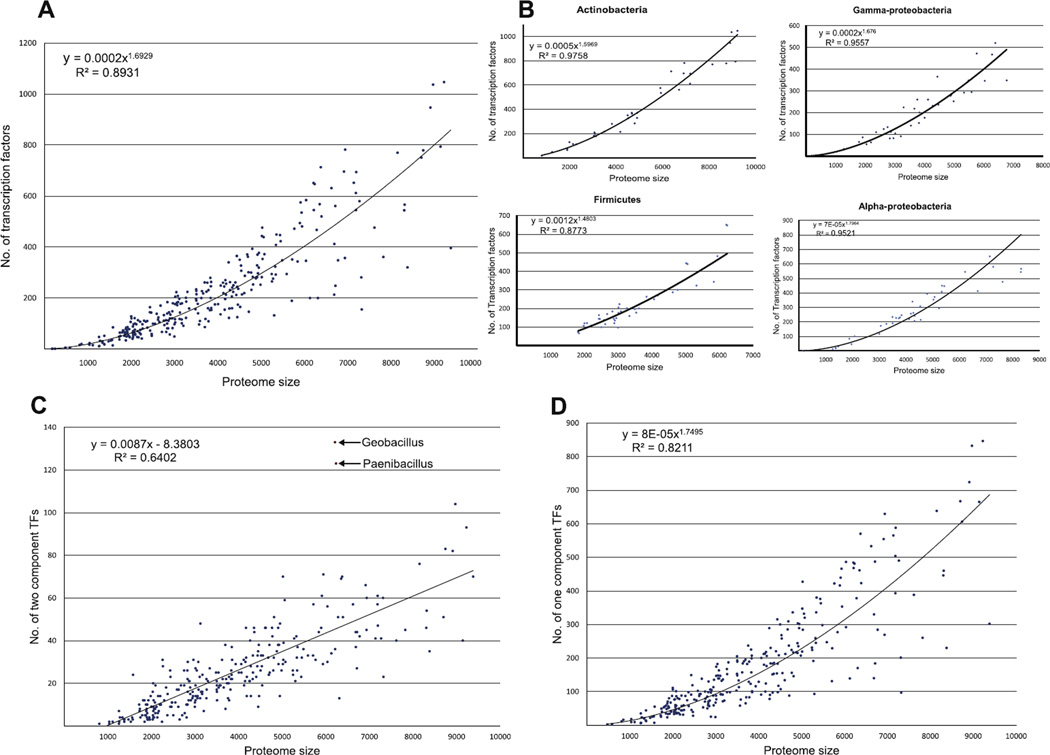
Fig. 6.
Scaling of bacterial transcription factors with proteome size. All graphs show a scatter plot of number of transcription factors in a given proteome (Y-axis) versus the number of protein-coding genes in that organism (X-axis). In (A) and (B), the Y-axis is the overall number of transcription factors across bacteria and in individual lineages respectively. In (C) The Y-axis is the number of predicted two-component system proteins. Note that anomalous numbers in Geobacillus and Paenibacillus that are shown as red points. (D) The Y-axis is number of one-component system and other phospho-relay system proteins.

