
Fig. 7.
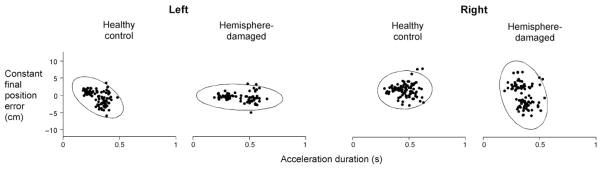
Constant final position error (y axis) and acceleration duration (x axis) of each trial (dot) are displayed for representative control subjects and hemisphere-damaged patients. Final position error is signed, such that positive values indicate overshoot of target, and negative values indicate undershoot of target. Ellipses represent the 99% confidence interval of the data from each subject.