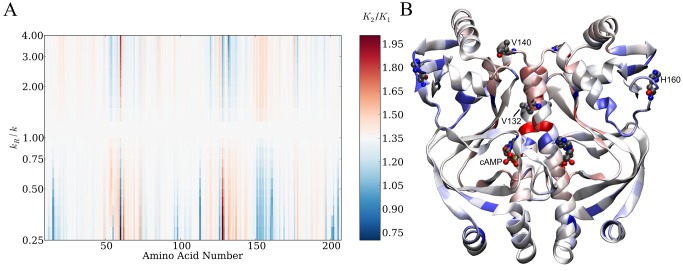
Figure 1. A global map for dynamic regulation of allostery in CAP.
(A) Global map for the ENM plotting amino acid number for the CAP monomer and dimensionless change in spring constant (k R/k; corresponds to k amino acid number/relative spring strength). The colour chart represents changes in the ratio of the second to first dissociation constants for cAMP. White corresponds to values of K 2/K 1 predicted by the wild-type ENM. Red corresponds to increased values of K 2/K 1 (increased negative cooperativity) and blue corresponds to decreased values of K 2/K 1 (decreased negative cooperativity and positive cooperativity). (B) The global map plotted in real space onto the wild-type CAP homodimer structure at k R/k = 0.25. The specific residues investigated in this study are indicated.

