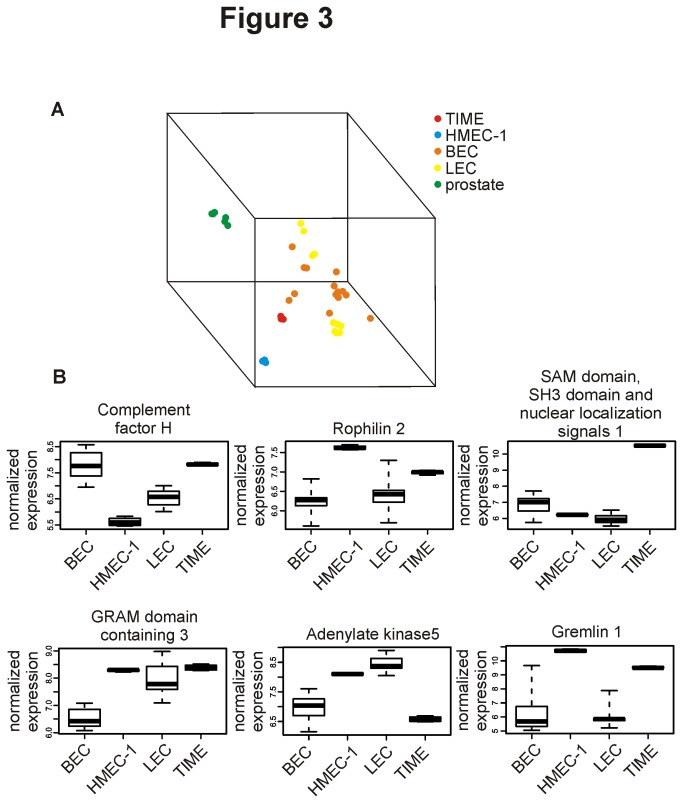
Figure 3. Gene expression profiles of HMEC-1 and TIME reveal differences from pure BEC and LEC.
(A) A multidimensional scaling plot (MDS-plot) showing clustering of TIME, HMEC-1, primary BEC and LEC (and prostate tissue as a control) based on the expression of about 19000 genes. (B) Exemplary genes that are differently expressed in HMEC-1 and/or TIME when compared to BEC and LEC in the normalized Dataset A. Data is presented as mean with the middle quartile and minimum/maximum values.

