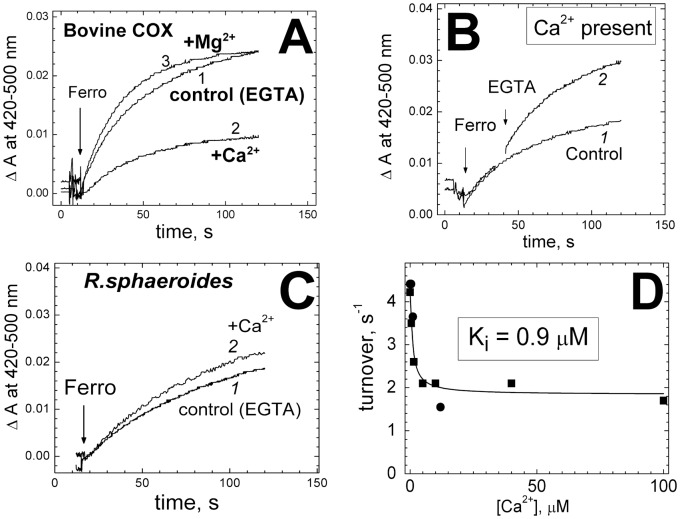
Figure 2. Ca2+ ions inhibit cytochrome c- catalyzed oxidation of ferrocyanide by cytochrome oxidase.
(A) 0.3 µM bovine COX in the basic medium (100 µM EGTA present) with 40 nM cytochrome c. Where indicated, 1 mM ferrocyanide (ferro) was added, and its oxidation to ferricyanide was followed spectrophotometrically at 420 nm vs the 500 nm reference. Trace 1, control recording; trace 2, +200 µM CaCl2 (100 µM excess over EGTA); trace 3, +0.4 mM Mg2+ (300 µM excess over EGTA). (B) Conditions, as in panel A, trace 2 (100 µM excess of CaCl2 over EGTA). In trace 2, 300 µM EGTA has been added. (C) 0.2 µM wild-type COX from R.sphaeroides. Trace 1, control (100 µM EGTA). Trace 2, with 200 µM CaCl2. (D) Concentration dependence of the inhibition. Initial rate of ferrocyanide oxidation by COX (0.3 µM) is plotted vs concentration of free Ca2+ buffered with 1 mM NTA (squares) or 1 mM BAPTA (circles). The curve corresponds to Ki of 0.9 µM and maximal inhibition of 60%.

