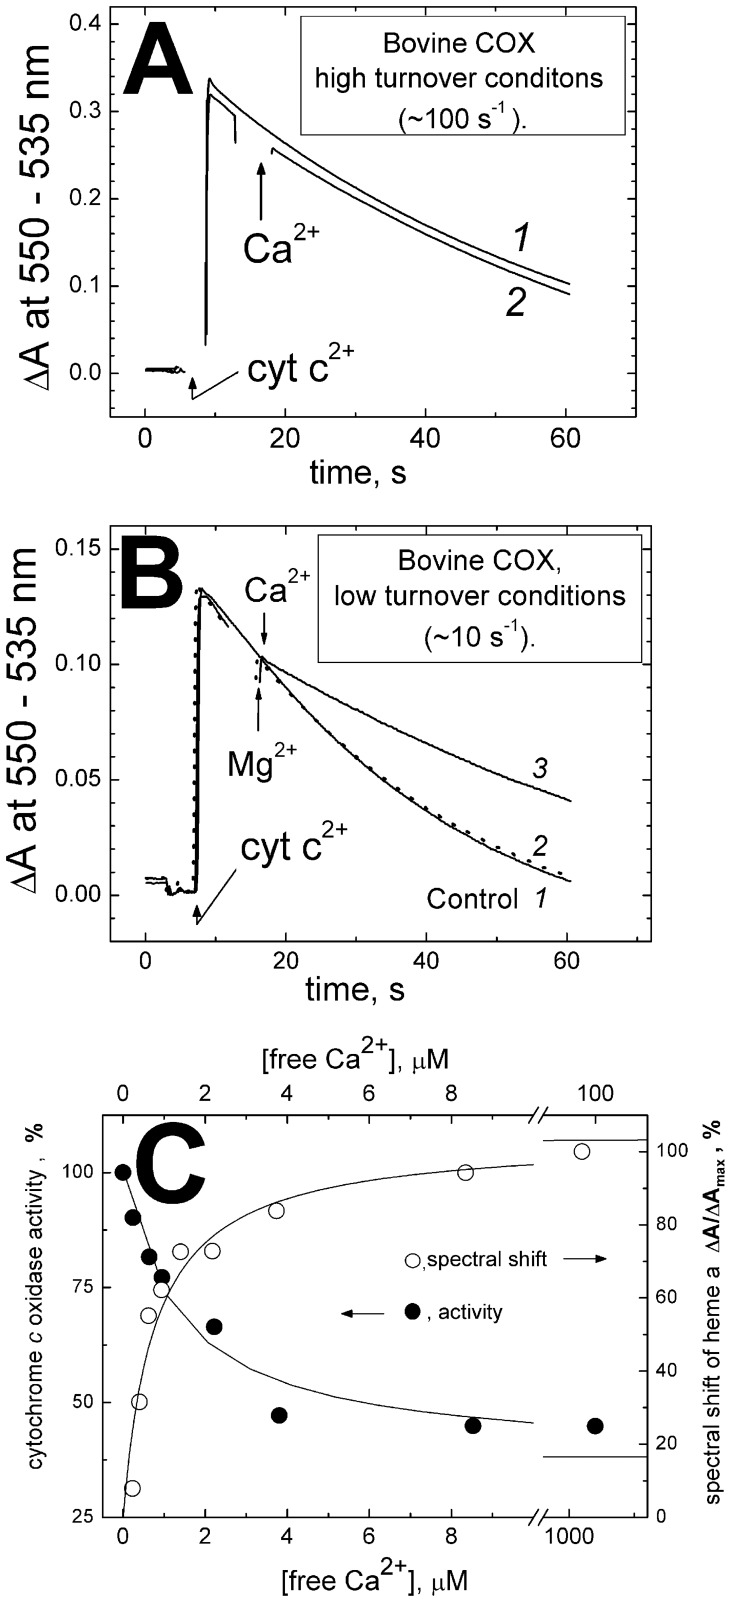
Figure 4. Inhibition of the ferrocytochrome c oxidase activity of bovine COX by Ca2+ ions.
(A) High-turnover conditions. 4 nM COX in the basic medium (with 50 mM choline chloride and 100 µM EGTA). 18 µM reduced cytochrome c is added and its subsequent oxidation is followed spectrophotometrically at 550 nm vs the 535 nm reference. Trace 1, control recording; trace 2, 200 µM CaCl2 added where indicated. (B) Low-turnover conditions. Conditions as in (A), but choline chloride concentration increased to 0.5 M and 18 µM oxidized cytochrome c present in the buffer; COX concentration raised to 20 nM. Trace 1 (solid line), control recording; traces 2,3: where indicated, 0.4 mM MgCl2 (dashed line) or 200 µM CaCl2 (solid line) are added. (C) Titration of the Ca2+-induced inhibition of COX activity and of the red shift of heme a spectrum. Cytochrome c 2+ oxidation was measured as in Panel B, trace 1 at different concentrations of free calcium buffered with 5 mM HEDTA. The initial rates were used to build the plot. Spectral shift measurements (see Materials and Methods) were made in the basic buffer with 2 µM COX. Concentration of free Ca2+ was buffered with 5 mM HEDTA. The points are fitted by the curves: maximal inhibition, 63±5%, Ki = 1.4±0.4 µM; the spectral shift, ΔAmax = 103% of the highest experimentally observed ΔA value taken as 100%; Kd = 0.77±0.19 µM.

