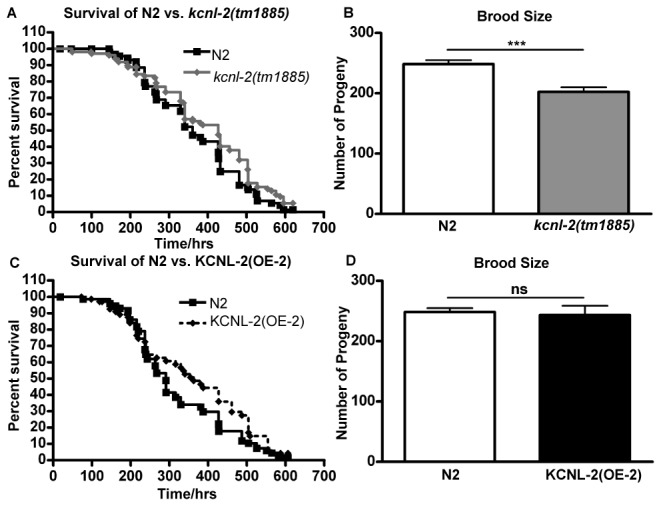
Figure 2. Phenotypic analysis of kcnl-2(tm1885) and KCNL-2(OE), a transgenic line that overexpresses p kcnl-2 kcnl-2(taa2)::gfp in the N2 background.

A,C. Kaplan-Meier Survival Curves showing the longevities of N2 vs. kcnl-2(tm1885) (n=80; p=0.06, Logrank test) or N2 vs. KCNL-2(OE-2) (n=50; p=0.12, Logrank test). B,D. Brood size of N2 vs. kcnl-2(tm1885) (n≥17; p<0.001, Student’s t test) or N2 vs KCNL-2(OE-2) (n≥13; p=0.77, Student’s t test).
