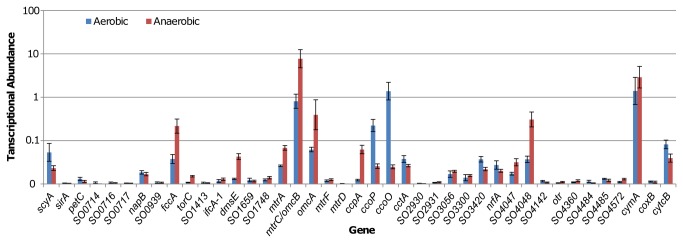
Figure 1. Expression of genes encoding c-type cytochromes in S. oneidensis.

qRT-PCR analysis of RNA extracted from mid-logarithmic growing cells (OD600, ~0.4 and ~0.15 for aerobic and anaerobic cultures respectively). All data were normalized to expression of the arcA and recA genes, which were constant during the exponential growth phase. Numbers reported are standardized to expression of the arcA gene, but the same trends are observed when standardized to expression of the recA gene. Error bars represent standard deviation for triplicate cultures. SO1778 is displayed as mtrC/omcB because both names have been used in previous publications, but only mtrC is used in the rest of this article since it is accepted more widely.
