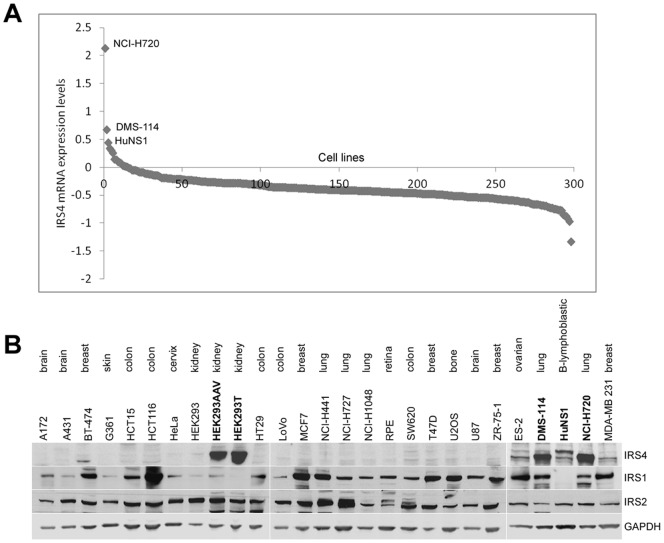
Figure 1. Expression of IRS4, IRS1 and IRS2 in various cell lines.
(A) The graph represents the IRS4 mRNA expression in 298 cancer cell lines. Data in Oncomine (www.oncomine.com) was searched for mRNA expression in cell lines, normalised with multiple probe sets [38]. The higher the value, the higher the expression of IRS4 mRNA. (B) Cell lysates from the indicated cell lines were subjected to immunoblotting with the IRS4, IRS1, IRS2 and GAPDH antibodies

