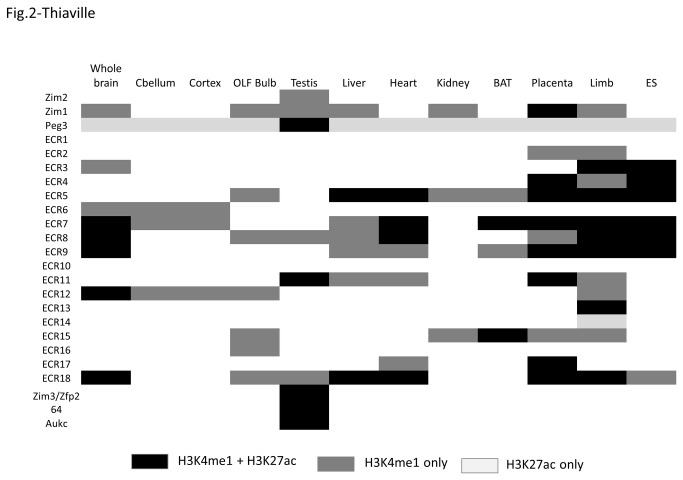
Figure 2. Summary of histone modification patterns on ECRs.
The table summarizes the histone modification patterns of H3K4me1 and H3K27ac in the Peg3 domain. The histone modification status of each locus (the name on the Y-axis) was presented for each tissue (the name on the X-axis). Black rectangles indicate the regions with both H3K4me1 and H3K27ac modifications; the darker grey ones indicate the regions with H3K4me1 only; and finally the lighter grey ones indicate the regions with H3K27ac only.

