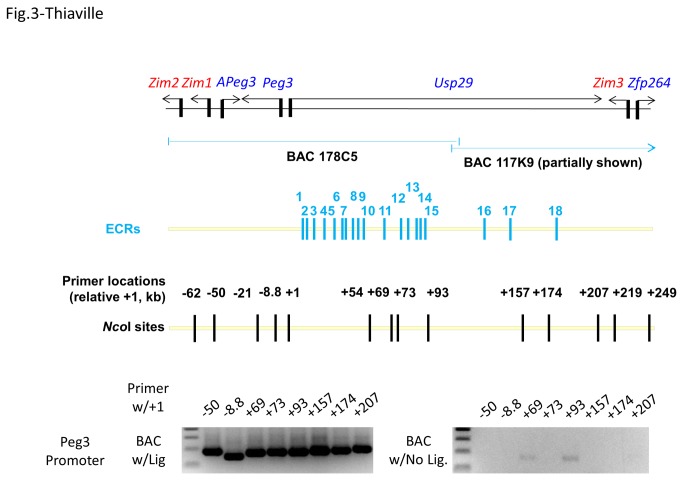
Figure 3. 3C strategy for the Peg3 domain.
The upper diagram details the genomic region covered by the two BAC clones (178C5 and 117K9) that have been used for preparing two control libraries, the relative positions of 18 ECRs, the relative positions of oligonucleotides that have been used for 3C experiments. Each oligonucleotide has been named with a numeric value to indicate its relative position to the transcription start site of Peg3. The gel images on the bottom panel show the results derived from the two sets of control experiments testing the efficiency and compatibility of each primer set. For both control experiments, the +1 oligonucleotide was used as a base primer, which intends to detect long-range interaction between the Peg3 promoter and other regions.

