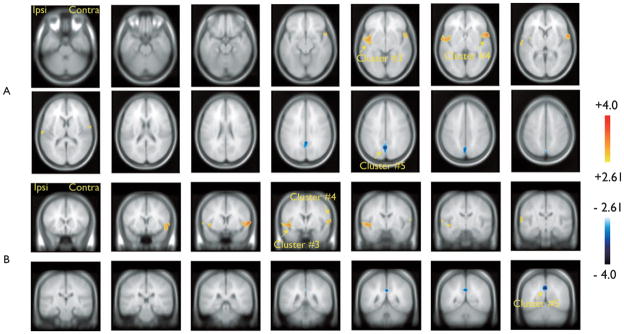
Figure 2.

Group analysis results for the hemodynamic response function (HRF) peaking 5 s after the temporal lobe (TL) spikes. Resulting t-map (p < 0.005 noncorrected) after cluster size test (p < 0.05 corrected for spatial extent). (A) Sagittal slices (6 mm); (B) Coronal slices (6 mm). Significant blood oxygenation level dependent (BOLD) activations were found ipsilaterally (cluster #3, Table 1) and contralaterally (cluster #4, Table 1) in the superior temporal gyrus and in the inferior insula. Significant BOLD deactivation was found in bilateral posterior cingulate regions (cluster #5, Table 1).
Epilepsia © ILAE
