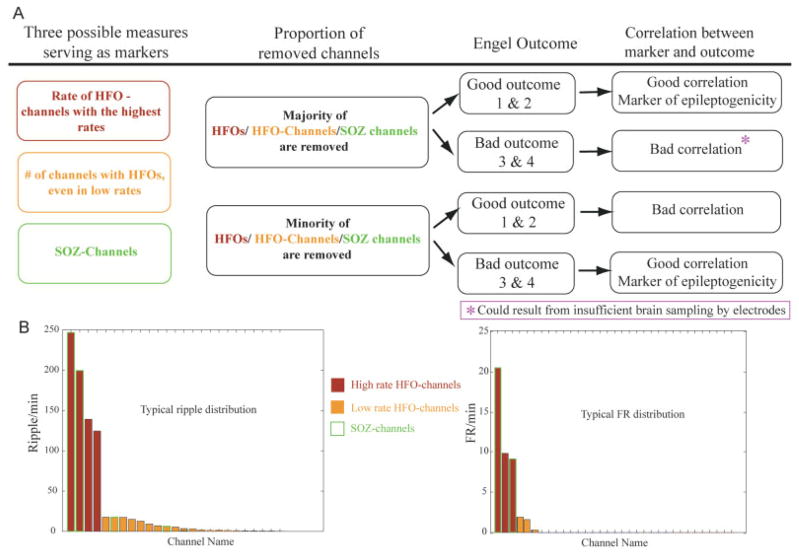
FIGURE 1.
This figure demonstrates our hypothesis. (A) The diagram illustrates the assumed relationship between the removal of the majority of measured events and the surgical outcome. Our hypothesis does not assume that all patients with a poor outcome must have remaining high-frequency oscillation (HFO)-generating regions. It might be that the majority of recorded HFOs are removed, but HFOs are generated in brain areas in which there are no electrodes. (B) Histograms in which channels are ranked according to event rates. The 2 graphs illustrate a typical distribution of ripples (left), some contacts having very high rates and many contacts having low rates, and fast ripples (FRs) (right), with similar numbers of contacts with high and low rates. In all patients, the distribution of FRs was restricted to much fewer channels than that of ripples. SOZ = seizure onset zone.

