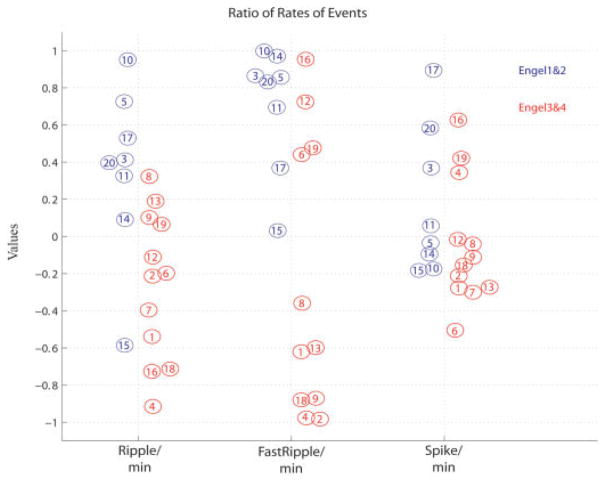
FIGURE 3.
Same data as in Figure 2A, but showing all patients. All patients with good outcome are in blue and patients with poor outcome in red circles. A number identifies each patient, so that it is possible to follow which marker (ripples on the left, fast ripples [FRs] in the middle, spikes on the right) is indicative of the outcome in each patient. Values >0 indicate that the majority of high-frequency oscillations (HFOs) are removed and patients should therefore have a good outcome (blue circles). One patient did not have any FRs (#7). The chart shows that, except for patient #15, all patients with good outcome had the majority of HFOs removed (values >0). This result can be stated differently: all patients with most HFOs remaining (values <0) had a poor outcome (except patient #15). We also notice that for patients with poor outcome, all but 1 (#19) had the majority of ripples or FRs remaining.

