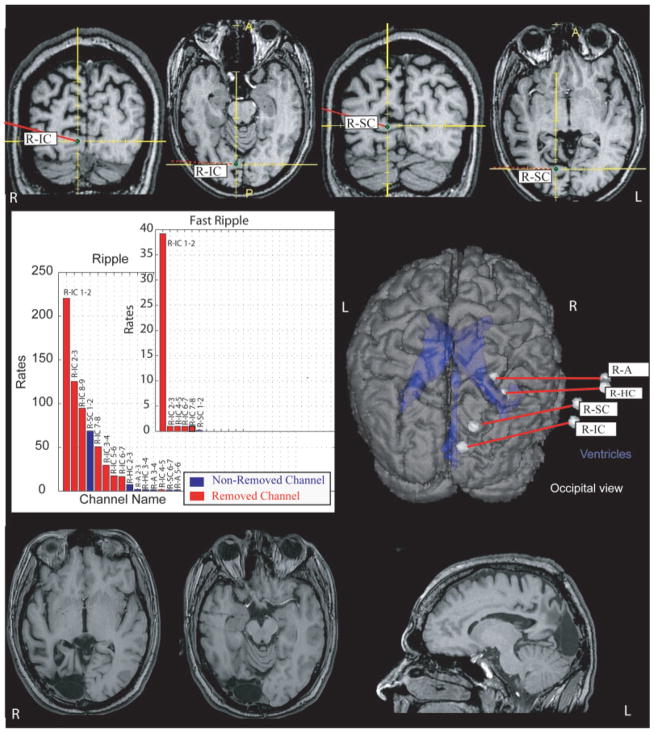
FIGURE 4.
Pre- and postsurgical magnetic resonance imaging (MRI) of patient #10 as an example of a patient with removal of most of high-frequency oscillation-generating tissue and a good outcome. The postsurgical MRI clearly shows that the areas around electrode R-IC were removed, whereas the tissue around the inner contacts of R-SC remained untouched. The axial view of the postsurgical MRI also demonstrates the electrode traces of R-A and R-HC. The graph illustrates the rates of ripples/fast ripples in contacts that were removed (red) and those that remained (blue). Only channels that had events are shown; ripples are found in more channels than fast ripples. A = amygdala; HC = hippocampus; IC = infracalcarine; L = left; R = right; SC = supracalcarine.

