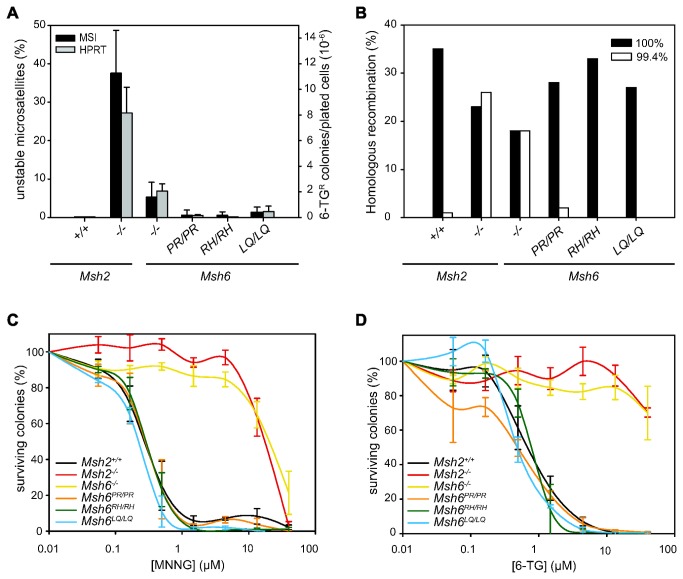
Figure 2. Functional analysis of Msh6 mut/mut ESC lines.
(A) Black bars show the average percentage of unstable microsatellites (left Y-axis) as measured in 96 colonies for two or three different dinucleotide markers. Error bars show standard errors, measured over two to six independent clones per cell line. The grey bars show the average number of 6-TG-resistant colonies per 106 plated cells (right Y-axis). Error bars show standard errors, measured over three to six independent clones per cell line. (B) Targeting efficiencies are shown in mutant and control cell lines for the 100% homologous (black bars) and the 99.4% homologous (white bars) Rb targeting constructs. Targeting efficiencies in Msh2 +/+ Msh2 -/- and Msh6 -/- ESCs are taken from de Wind et al. [10,18] and shown as controls. (C) Survival of mutant and control cell lines exposed to MNNG (n=2-6). (D) Survival of mutant and control cell lines exposed to 6-TG (n=2-5). Error bars show standard errors from independent experiments.

