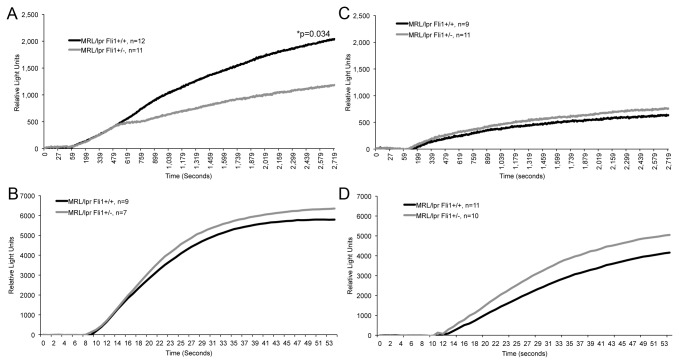
Figure 3. Intracellular Ca2+ levels are significantly reduced in Fli1 +/- T cells compared to Fli1 +/+ T cells from early disease stage mice following TCR-specific activation.
T cells from the spleens of MRL/lpr Fli1 +/+ and Fli1 +/- 10-12 week-old (A and B) and 17-18 week-old (C and D) mice were stimulated with anti-CD3/CD28 (A and C) or PMA/ionomycin (B and D) and Ca2+ influx measured over time. PMA/ion was added 5 seconds after beginning data collection and data was collected for 1 min. Anti-CD3/CD28 antibodies were added just before beginning data collection and data was collected for 45 minutes. All data collection points are presented from 0–60 sec for PMA/ion and 0-45 minutes for anti-CD3/CD28. The ‘n’ represents data from individual animals and p values are provided within the figure.

