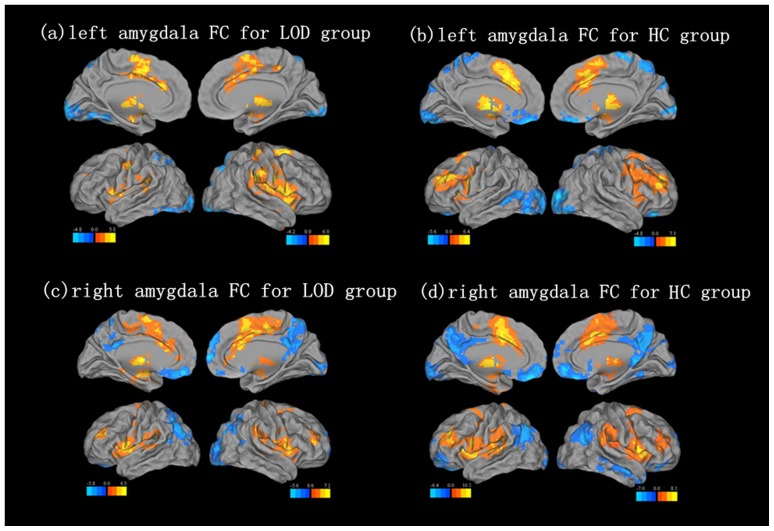
Figure 2. Maps of functional connectivity with Amygdala in the results of one sample t-test.
Resting state left amygdala FC pattern for (a) LOD group, (b) HC group. Resting state right amygdala FC pattern for (c) LOD group, (d) HC group. Corrected with Monte Carlo simulation, P<0.05, Cluster size is more than 119 voxels.

