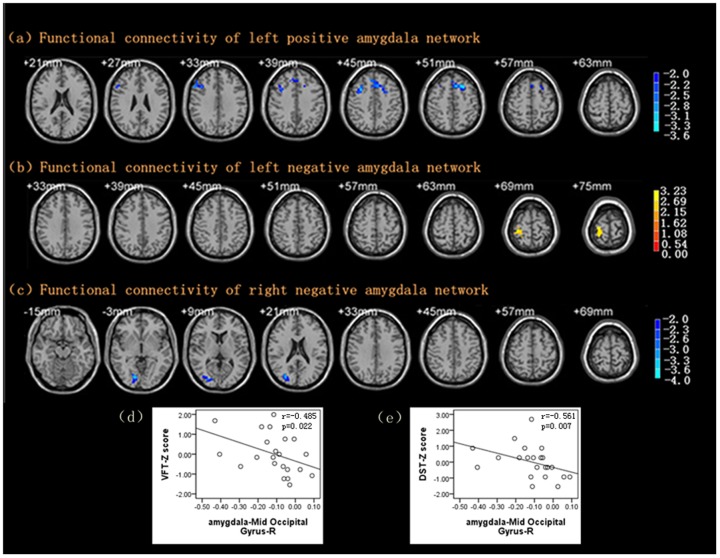
Figure 3. Maps of functional connectivity of Amygdala.
(a) Decreased functional connectivity of left amygdala positive network in LOD compared with HC with a corrected threshold of P<0.05, determined by Monte Carlo simulation. Cluster size is more than 119 voxels. (b) Increased functional connectivity of left amygdala negative network in LOD compared with HC with a corrected threshold of P<0.05, determined by Monte Carlo simulation. Cluster size is more than 77 voxels. (c) Decreased functional connectivity of right amygdala negative network in LOD compared with HC with a corrected threshold of P<0.05, determined by Monte Carlo simulation. Cluster size is more than 86 voxels. (d) − (e) Significant negative correlation between FC with right amygdala and VFT/DST. VFT: Verbal fluency test; DST: digit span test; r = spearman’s correlation coefficient.

