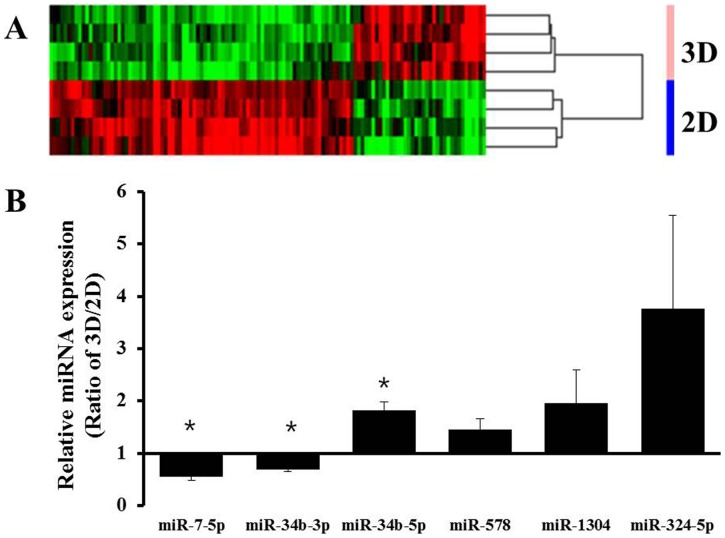
Figure 6. The miRNA expression profiles were compared between 2D and 3D cultures.
A heatmap of differentially expressed miRNAs generated by unsupervised hierarchical cluster analysis (A). Differential expression levels of miRNAs between 2D and 3D cultures were confirmed using qRT-PCR for several genes selected from microarray data. Among the differentially expressed miRNAs, up-regulated miRNAs including miR-34b-5p, miR-578, miR-1304, and miR-324-5p and down-regulated miRNAs including miR-7-5p, and miR-34b-3p were analyzed using primers for mature mRNAs (B). Data are expressed as the mean ± SE of triplicates. * p<0.05, n = 3.

