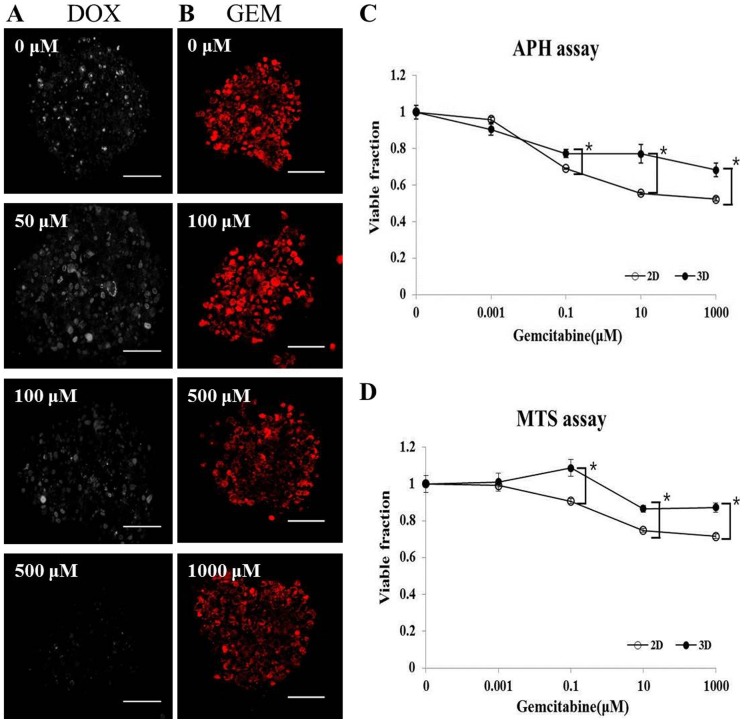
Figure 8. Cytotoxicity/viability assays for Panc-1 spheroids.
Changes in Ki-67 expression were measured following exposure to DOX at the indicated concentrations for 12 h (A). Changes in MitoSOX were measured following exposure to GEM at the indicated concentration for 12 h (B). MTS (C) and APH assay (D) after exposure to GEM for 72 h. Data are expressed as the mean ± SE of 6 replicates. (Scale bar = 100 μm) * p<0.001.

