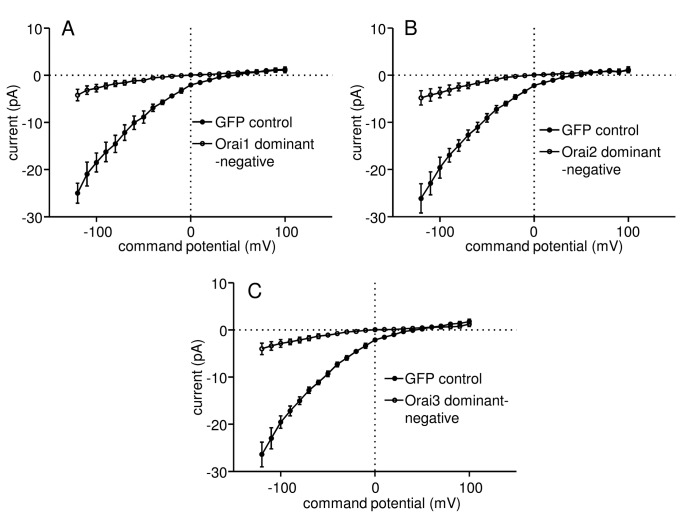
Figure 5. Expression of dominant negative mutations of Orai1-3 greatly reduce Ca2+ influx into activated HLMCs.
Subtracted whole cell patch clamp current-voltage (I–V) curves from HLMCs transduced with recombinant adenoviruses expressing (A) GFP n=14 cells (●) or Orai1 E106Q n=15 (○), (B) GFP n=11 (●) or Orai2 E80Q n=14 (○), and (C) GFP n=11 (●) or Orai3 E81Q n=13 (○). Currents (mean ± SEM) were recorded in 2 mM external Ca2+ following dialysis with 3 µM IP3 for 4 min.

