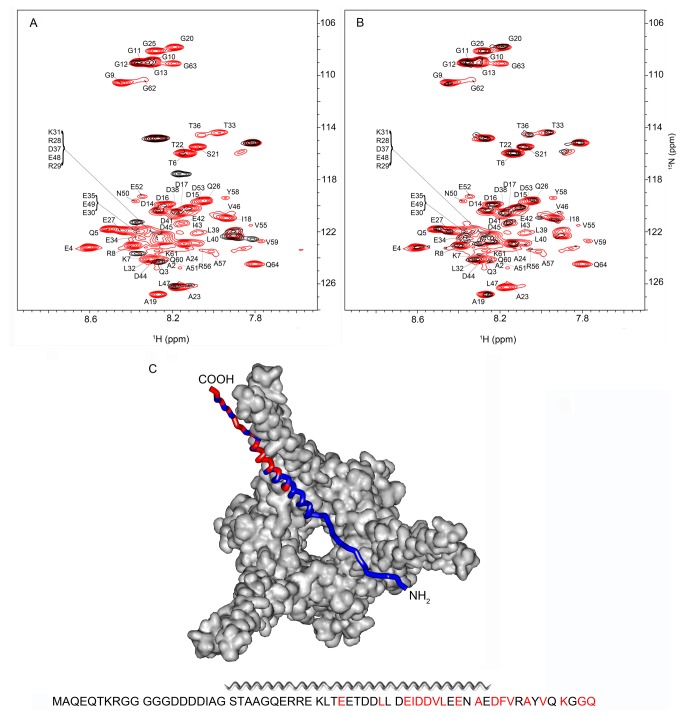
Figure 2. Pup-GGQ interacts with Msm Mpa through its N-terminus, C-terminus and α-helix.
A. Overlay of E. coli 1H{15N}-HSQC spectra showing [U- 15N] Pup-GGQ after 4 h of over-expression (red), and after 4 h of over-expression following 16 h of Msm Mpa over-expression (black). B. Overlay of E. coli 1H{15N}-HSQC spectra showing [U- 15N] Pup-GGQ after 4 h of over-expression (red) followed by 16 h of Msm Mpa over-expression (black). C. Ribbon model of Pup docked with Msm Mpa. The sequence of Pup-GGQ is below the image. Residues that broadened the most upon complex formation with Msm Mpa are shown in red. The model is created by Swiss-PDB Viewer [43] based on the Pup-GGE-Mtb Mpa complex [21]. For quantitation of changes in chemical shifts and peak intensities see Figure S2 .

