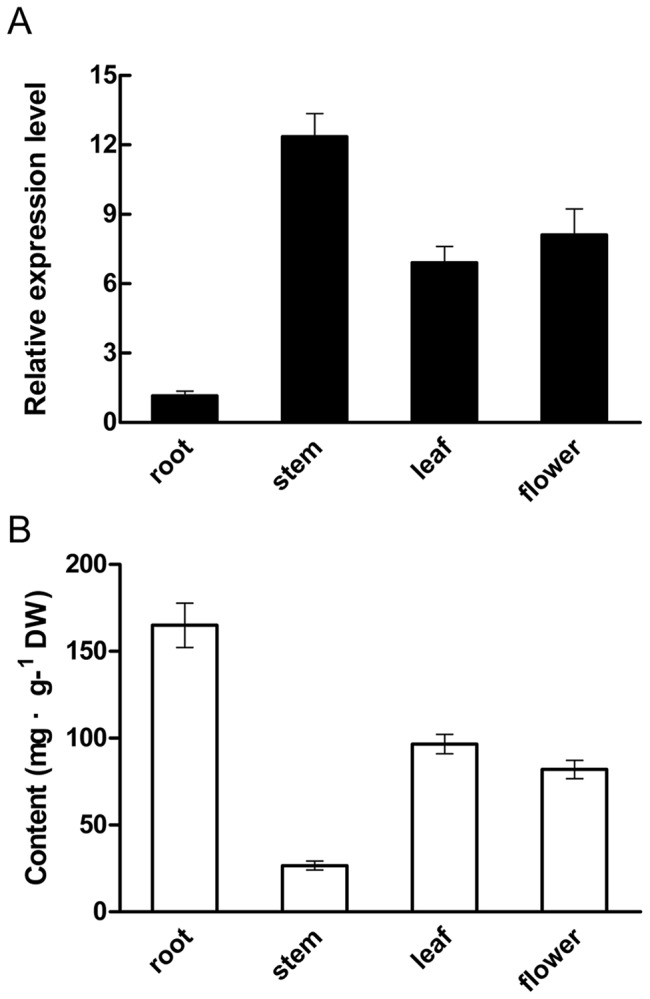
Figure 4. Relative expression levels of SmMYB39 (A) and total phenolics content (B) in different tissues of S. miltiorrhiza.

The results were analyzed using the comparative Ct method and presented as fold-changes compared with the root. The S. miltiorrhiza actin gene was used as an internal control to normalize expression levels. Data presented here are the mean of three replicates with error bars indicating ± SD.
