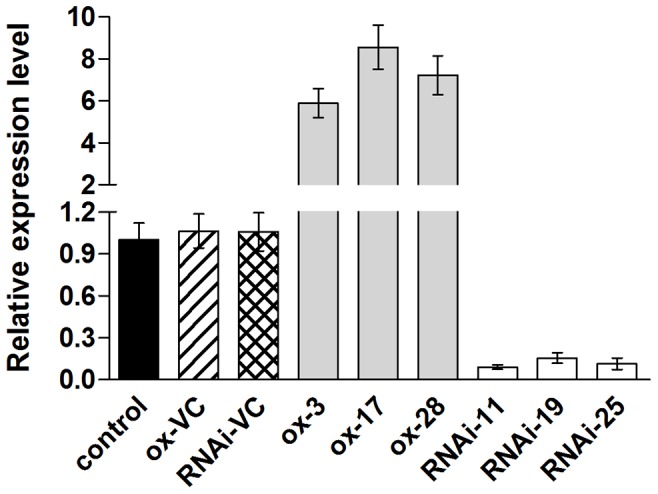
Figure 5. Relative quantitative analysis of SmMYB39 expression in transgenic lines and controls of S. miltiorrhiza.

The results were analyzed using the comparative Ct method and presented as fold-changes compared with the control sample (untransformed control). The S. miltiorrhiza actin gene was used as an internal control to normalize expression levels. control: untransformed plant; ox-VC, RNAi-VC: empty vector controls of SmMYB39-overexpressing lines and SmMYB39-RNAi lines; ox-3, ox-17, ox-28: SmMYB39-overexpressing lines; RNAi-11, RNAi-19, RNAi-25: SmMYB39-RNAi lines.
