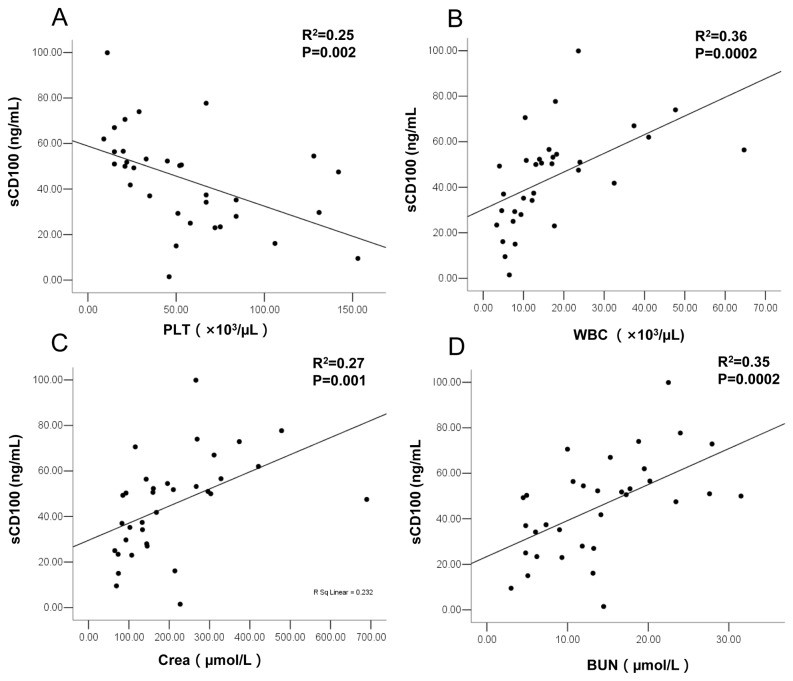
Figure 2. Relationship between elevated plasma sCD100 level and clinical parameters.
The values derived from the same blood sample in febrile or hypotensive stage at the time of admission. Multivariate linear regression analysis of plasma sCD100 level (dependent variable) with clinical parameters (X1) and age (X2) as independent variables were performed. Platelet count (PLT) (A), white blood cell count (WBC) (B), serum creatinine level (Crea) (C), and blood urea nitrogen level (BUN) (D) (n=33) were shown. The adjusted R2 and P value are plotted in each graph.

