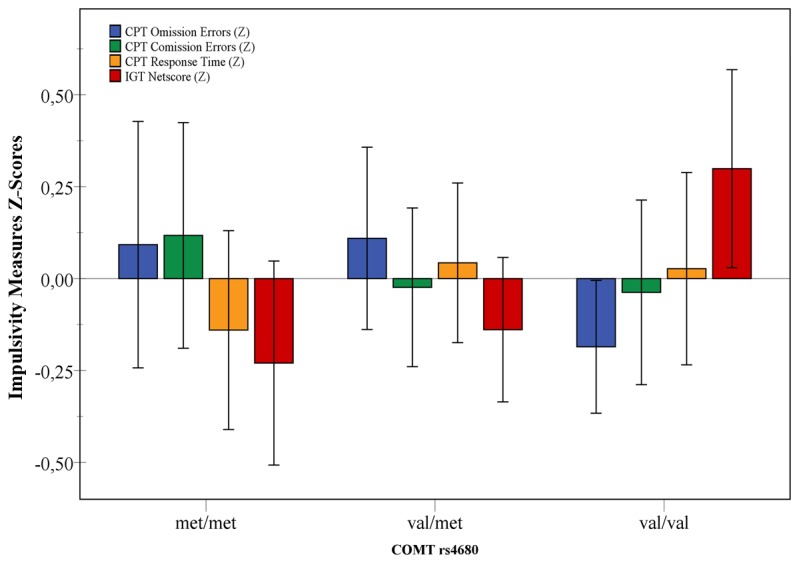
Figure 1. Mean Z-Scores for each Impulsivity measure along the COMT val158met groups.

Significant differences were found on General Linear Models val homozygous when compared to val heterozygous (p=0.023) and met homozygous (p=0.019), with moderate effect sizes, suggesting a more impulsive response pattern by met carriers. No significant differences were found on CPT measures.
