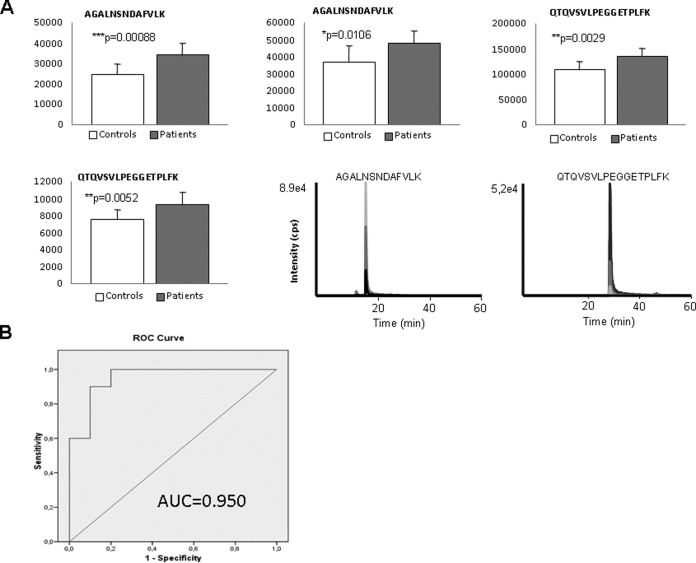
Fig. 6.
SRM results in crude plasma (n = 43 patients and n = 37 controls) for gelsolin. A, Graphical representation of the abundance and representative extracted ion chromatograms of significant transitions. B, ROC curve, calculated with the three significant transitions measured by peptide for a total of two peptides.

