
Figure 5. Summary of GIA data for antibodies tested against three strains of P. falciparum.
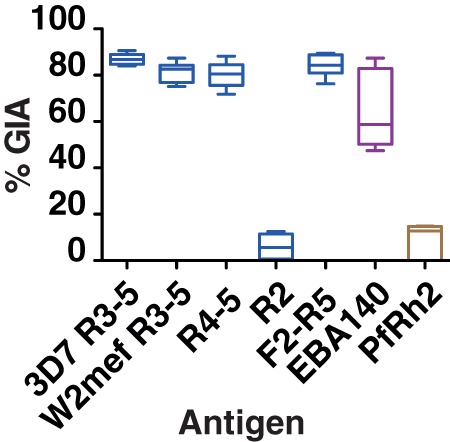
Data is represented as box and whiskers plot; line represents the median inhibition of a particular antibody against the three strains 3D7, FCR3 and W2mef; box, interquartile range; and whiskers GIA minimum and maximum values. Data included in the analysis are derived from triplicate wells in 3 independent, 2-cycle assays with IgG at a concentration of 2 mg/ml. Anti-EBA-175 values in blue, anti-EBA-140 in purple and anti-Rh2 antibodies in brown. Error bars represent SEM.