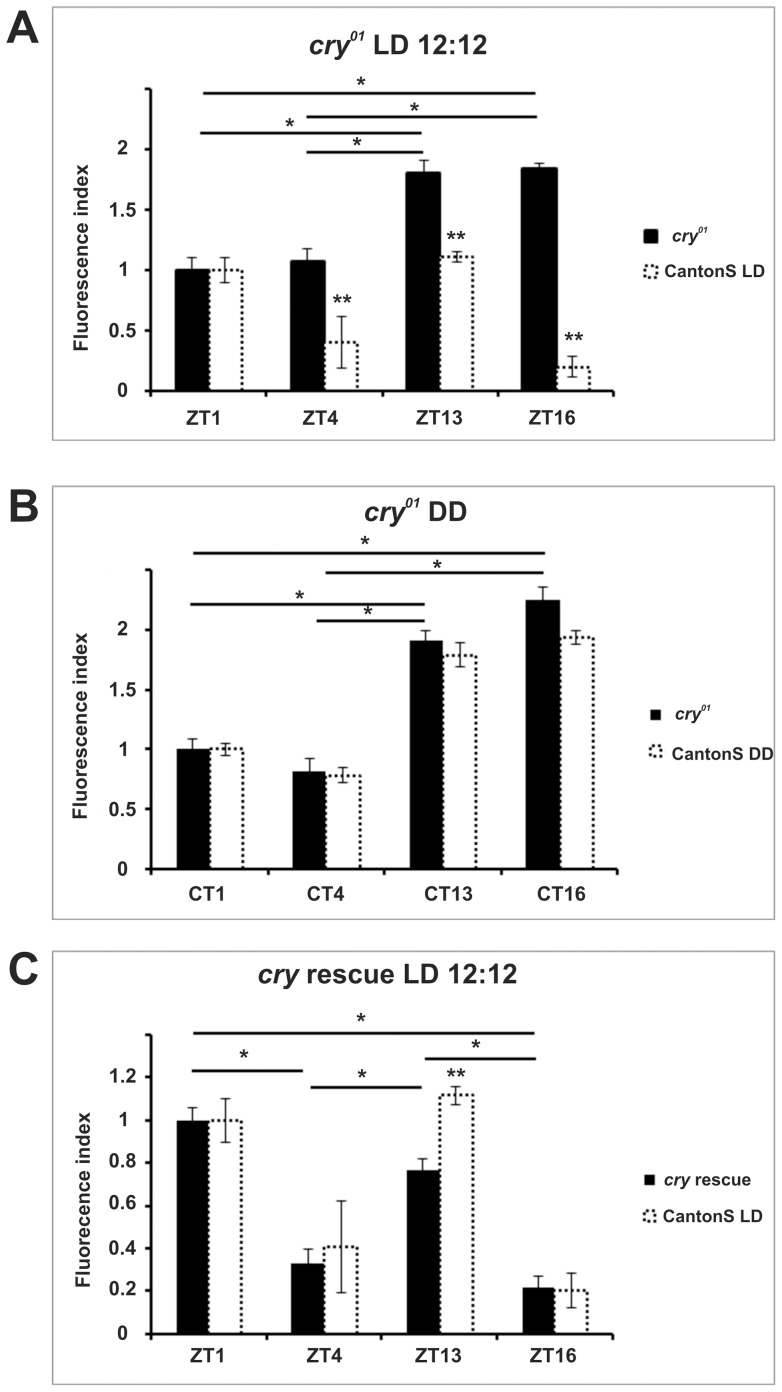
Figure 4. Pattern of ATPα immunoreactivity in cry01 mutants under LD (A) and DD (B) and in rescue flies under LD (C).
The fluorescence index ± SE is shown as a function of time. (A) cry01 mutants under LD. ZT1 and ZT4 are significantly different from the other time points. The immunoreactivity of the α subunit was highest at ZT16 and decreased at other time points (ZT13 by 16%, ZT1 by 50.08%, and ZT4 by 56.4%). (B) cry01 mutants under DD. The pattern of immunoreactivity was similar to LD conditions. The highest level of immunoreactivity was reached at CT16 and decreased by 15.3%, 55.8% and 63.7% at CT13, CT1 and CT4, respectively. (C) cry rescue under LD. Peak immunofluorescence was at ZT1 and then decreased by 70%, 20% and 82% at ZT4, ZT13 and ZT16, respectively. There are statistically significant differences between ZT1 and ZT4, ZT1 and ZT16, ZT13 and ZT4, ZT13 and ZT16. Parametric ANOVA Tukey's test; p<0.05. The two stars symbols indicate statistically significant differences between the experimental strains and CantonS controls at different time points.

